The FMCSA SMS changes took effect December 1, 2025: 959 individual violations were folded into 116 Violation Groups, BASICs became Compliance Categories, and severity weights dropped from a 1-to-10 scale to two tiers. It’s the biggest Safety Measurement System overhaul since CSA launched in 2010, and it changes how a carrier’s safety scores should be cited in a truck accident case.
Last updated 2026-09-20 · Reflects the December 1, 2025 SMS overhaul (Federal Register 2024-27087).
Pull up any carrier on SAFER and you’re looking at its Safety Measurement System (SMS) record. For fifteen years that record has been some of the most-cited evidence in truck accident cases, because it’s public, searchable, and puts every U.S. motor carrier on the same scale. Most drivers just call it the company’s CSA score.
On December 1, 2025 the whole system was rebuilt, with new category names, a new violation taxonomy, a new severity scale, and a new lookback rule. So any SMS printout in a case file comes from either the old system or the new one. Mixing them up in a brief is an easy mistake, and an avoidable one.
This is the injured person’s side of the story: what changed and why it matters to a claim, not a fleet-manager compliance guide. If a carrier’s SMS record is central to your case, a big rig truck accident lawyer can pull the right vintage of the profile; start with a free case review.
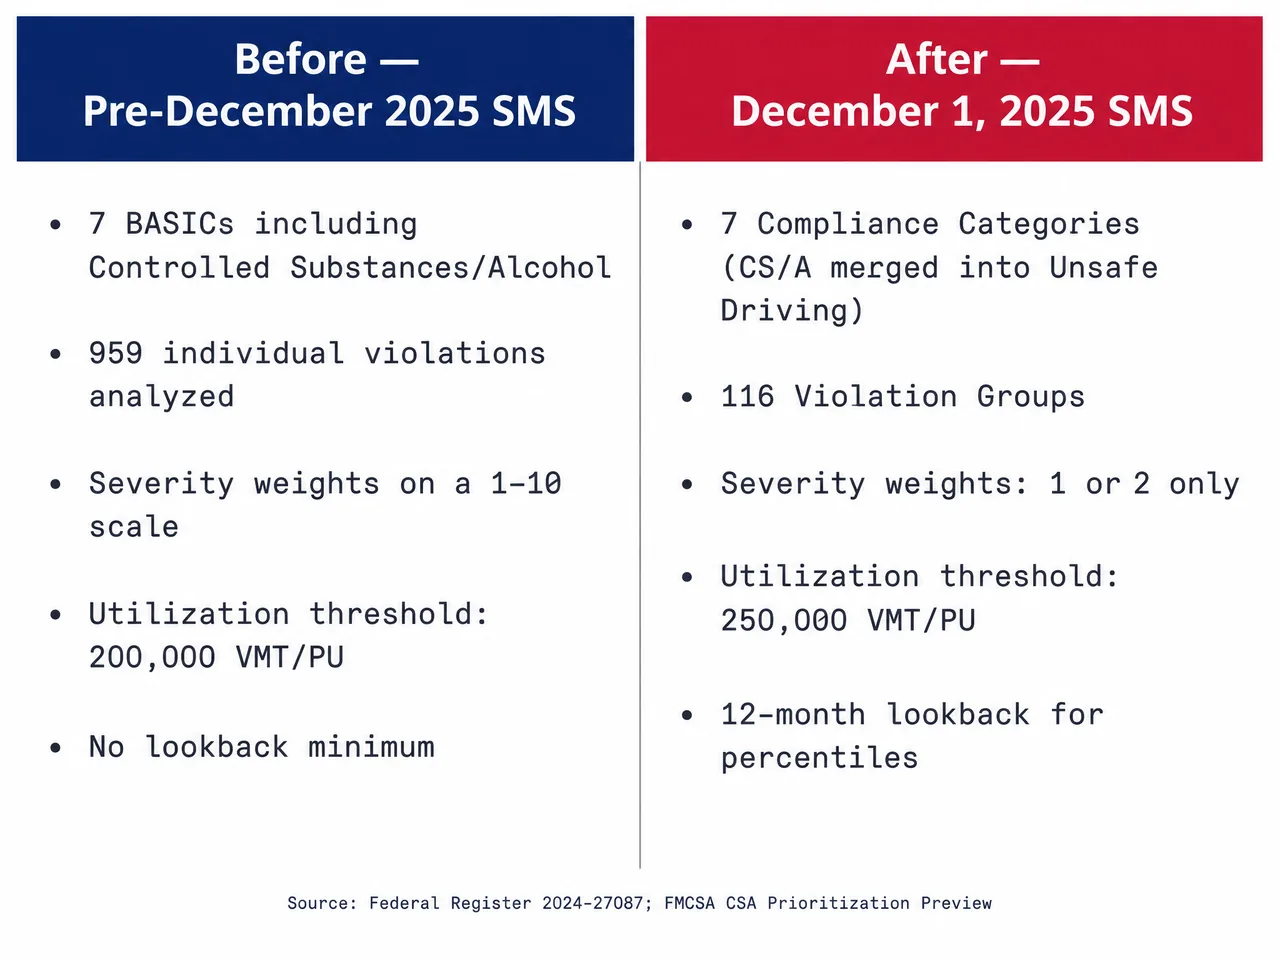
The five headline changes, in one table
| What changed | Before December 1, 2025 | After December 1, 2025 |
|---|---|---|
| Category naming | 7 Behavior Analysis and Safety Improvement Categories (BASICs) | 7 Compliance Categories (Controlled Substances/Alcohol removed and merged into Unsafe Driving; new Vehicle Maintenance: Driver Observed category added) |
| Violation taxonomy | 959 individual violations, scored line by line | 116 Violation Groups — similar violations bundled (HOS specifically dropped from 73 to 9 groups) |
| Severity weights | 1-to-10 scale, per-violation weighting | Two tiers: Weight 2 for Out-of-Service and 49 CFR 383.51 disqualifying offenses; Weight 1 for everything else |
| Utilization Factor threshold | 200,000 VMT per average Power Unit | 250,000 VMT per average Power Unit |
| Lookback rule | Percentiles calculated when the carrier had record activity | 12-month lookback: percentiles only calculated if the carrier has ≥1 roadside violation in the category within the past 12 months |
The definitive violation count is 116, not ~100
"The updated SMS methodology groups 959 violations into 116 Violation Groups… simplified severity weights replacing a 1-10 scale with a 2-value scale."
— Federal Register 2024-27087, Enhanced Carrier Safety Measurement System, cross-verified in FMCSA CSA Prioritization Preview Q&A materials.
Most trade press said "approximately 100" groups. That’s just rounding. When the exact count matters in a brief, use 116 and cite the Federal Register notice.
How the SMS got here: a fifteen-year timeline
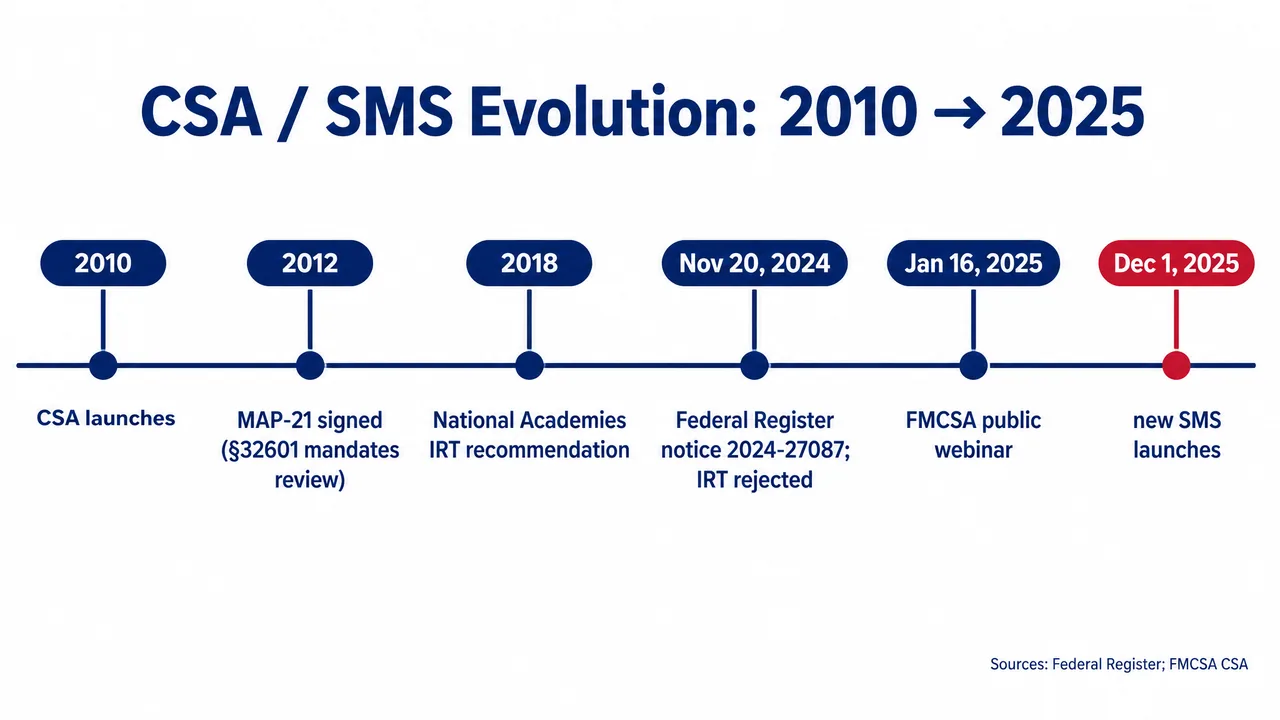
This overhaul closed out a decade of arguing over whether SMS scores were statistically sound. Knowing how it got here helps a judge or jury see why the numbers changed and what they mean now.
- December 2010: FMCSA launches Compliance, Safety, Accountability (CSA) and the SMS. Seven BASICs anchor the system.
- 2015–2017: Congress orders the National Academies of Science (NAS) to review SMS methodology. The 2017 NAS report recommends Item Response Theory (IRT) as a replacement statistical model.
- 2017–2024: FMCSA drafts, tests, and iterates. IRT is piloted but ultimately abandoned — FMCSA determines it is too inherently complex and does not measurably improve carrier risk identification.
- November 20, 2024: Federal Register notice 2024-27087 publishes the final SMS methodology overhaul.
- January 16, 2025: FMCSA hosts a public webinar walking industry through the changes.
- December 1, 2025: New methodology takes effect. SAFER now surfaces the new categories and Violation Groups on every carrier profile.
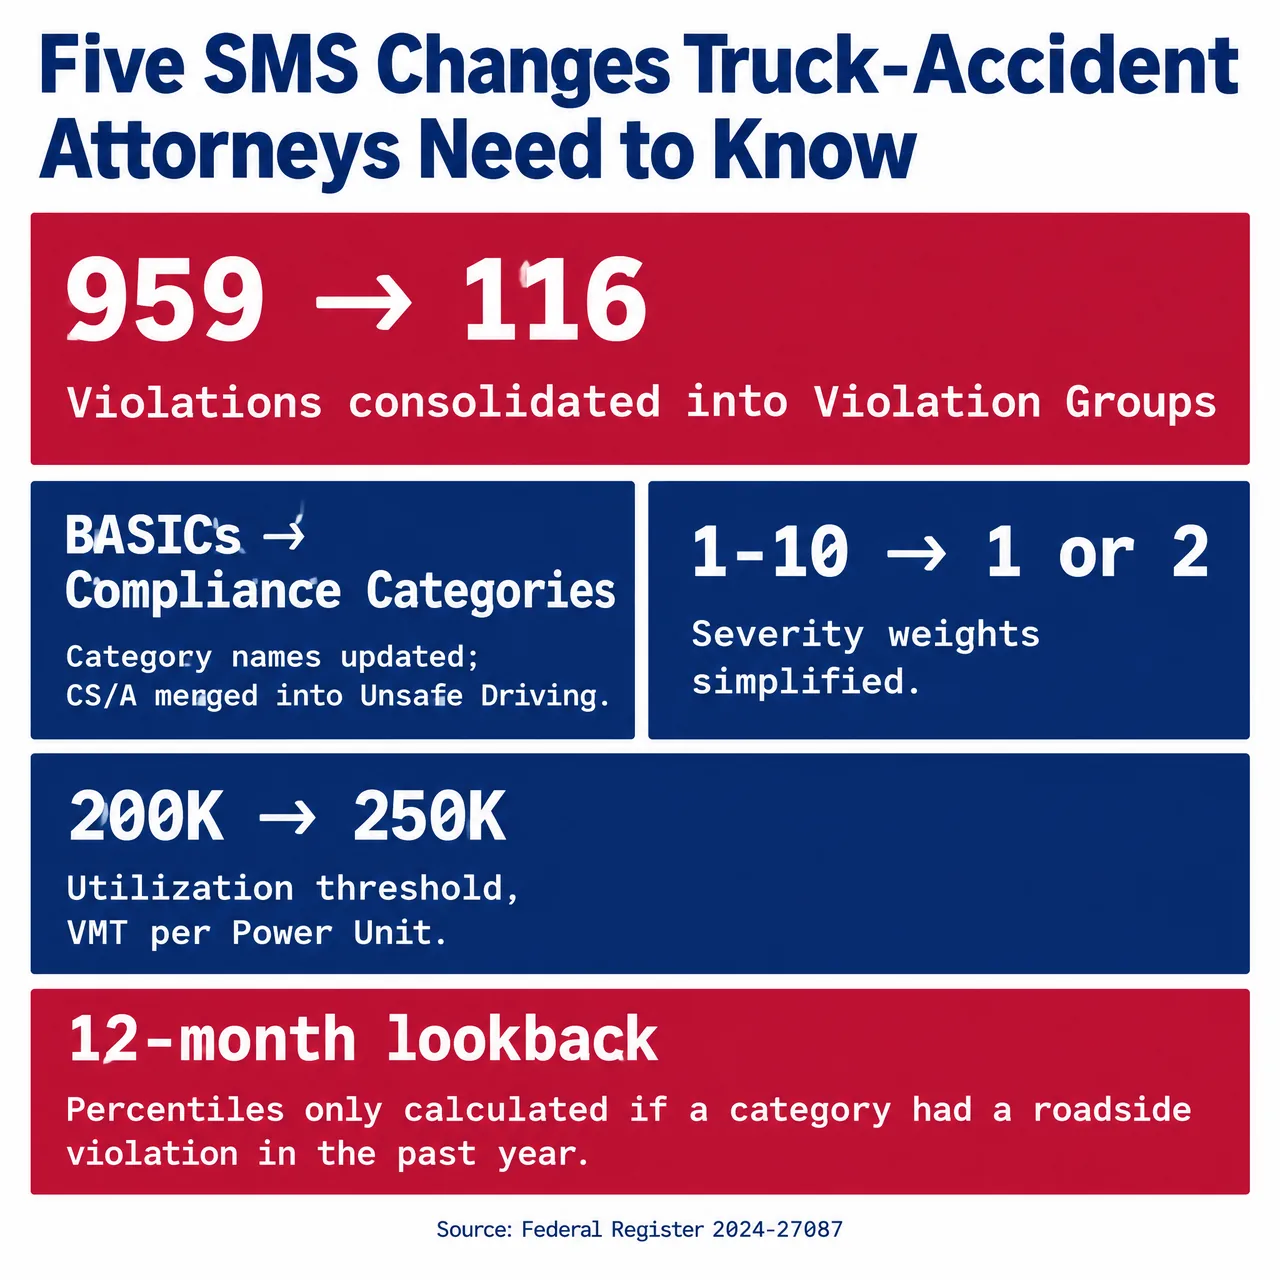
The five changes attorneys need to know
1. BASICs are Compliance Categories now
It’s a rename, plus one merger and one addition. Controlled Substances/Alcohol violations are now scored under Unsafe Driving rather than a standalone category. A new Vehicle Maintenance: Driver Observed category captures deficiencies a driver flagged that management did not remediate (think of a defect written up on a DVIR that never got fixed). In practice, older briefs that cite "the Controlled Substances/Alcohol BASIC" on a carrier’s pre-2025 profile have to be squared with post-2025 profiles that no longer show that category.
2. 959 violations became 116 Violation Groups
This one matters more than the new names. Hours-of-Service violations alone went from 73 individual codes to 9 groups. Say a carrier’s pre-2025 profile shows "12 HOS violations of eight different codes." On a post-2025 profile, that same history may show up as three group-level entries. The inspections didn’t change; the way they’re displayed did. So discovery requests should ask for the underlying inspection records, not just the grouped summary.
3. Two-tier severity replaces the 1–10 scale
Weight 2 = Out-of-Service or 49 CFR 383.51 disqualifying offense. Weight 1 = everything else. Under the old system, a plaintiff could tell a jury a violation was "weighted 8 out of 10." That line is gone. Now the question is Out-of-Service or not, and the argument should cite the underlying regulation directly.
4. Utilization Factor threshold raised to 250,000 VMT
Small carriers that don’t run a lot of miles now have to hit a higher activity threshold before their scores settle. A carrier that scored high on a BASIC under the old 200,000 VMT rule may not show a comparable percentile under the new 250,000 rule if its trucks sit a lot.
5. 12-month lookback for percentile calculation
Under the old system, old violations kept feeding percentile calculations for years. Under the new rule, if a Compliance Category has no roadside violation in the past 12 months, no percentile is calculated. The older violations are still in the record, and SAFER still displays them, but they no longer produce a category score.
This is the change most likely to trip people up during the transition. A carrier with a bad pre-2024 history and a clean 2025 may look like it "improved," when really the lookback window just got shorter.
How to pull the right SMS printout in discovery
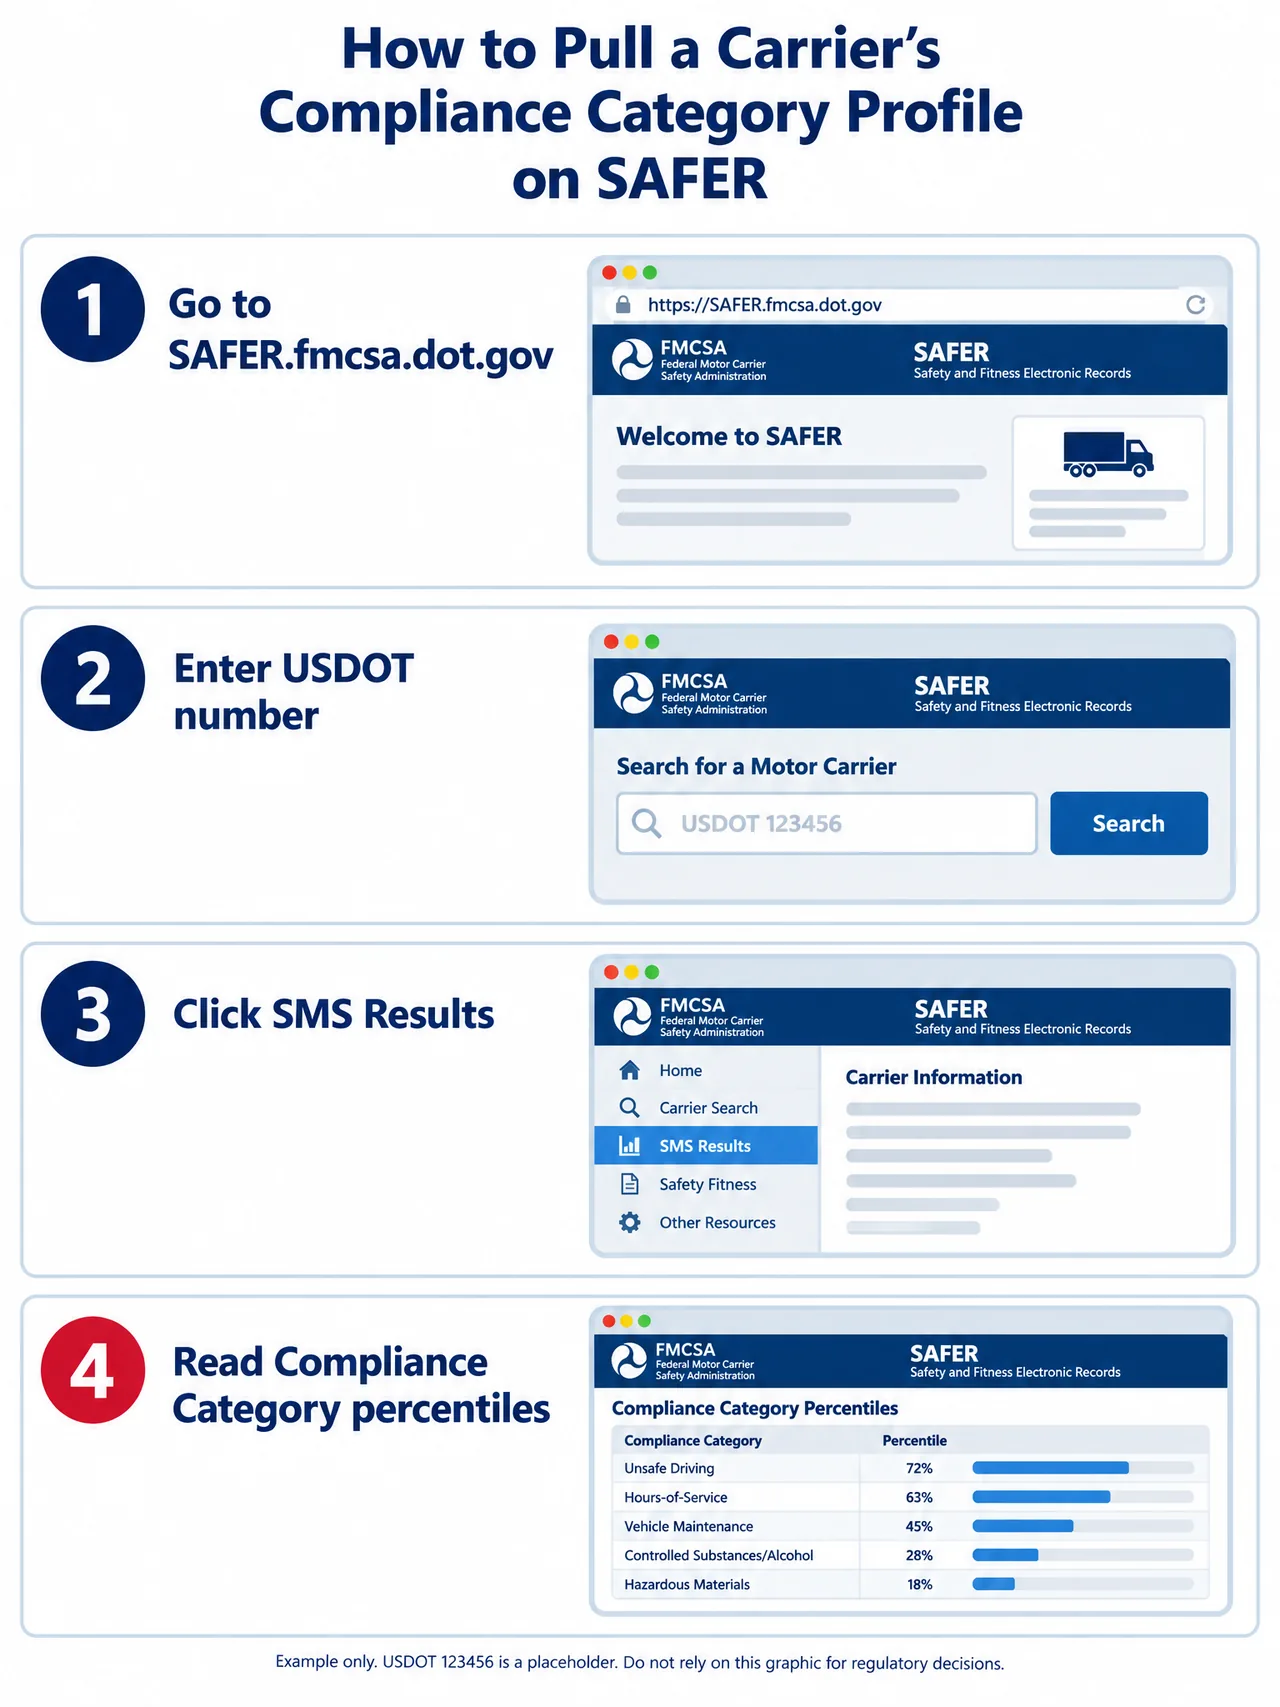
SAFER (safer.fmcsa.dot.gov) is where anyone can look a carrier up by USDOT number. The CSA Prioritization Preview portal at csa.fmcsa.dot.gov/prioritizationpreview publishes the new methodology and its documentation. For a specific carrier (we don’t name real carriers here), this discovery sequence captures both the old and new pictures:
- Request the carrier’s SAFER Company Snapshot as of the date of the crash, and again as of the date of the discovery request. Both are date-stamped.
- Request the SMS Public Snapshot for the same two dates. The pre-December-2025 version shows BASICs and the 1–10 scale; the post-December-2025 version shows Compliance Categories and Violation Groups.
- Request the underlying roadside inspection reports — the raw evidence beneath either presentation. The methodology change did not touch the inspection records themselves.
- If percentile testimony is central to your case, request the carrier’s Utilization Factor figures used in the percentile calculation for both eras. A shift from the old 200,000 to the new 250,000 VMT threshold can produce dramatic percentile movement without any underlying safety change.
See FMCSA regulations and the evidence that wins truck accident cases for the surrounding evidence-preservation playbook, and who can be held liable when the carrier’s safety record supports vicarious or direct-negligence theories.
What did not change
The overhaul changed the math, not the rules. It did not change:
- The underlying regulations. HOS limits, maintenance duties, drug and alcohol testing, and insurance minimums are unchanged. Only how violations of those regulations are aggregated into scores changed.
- The roadside inspection process. State enforcement officers still write the same inspection reports; only how those reports feed the score changed.
- The discoverability of a carrier’s history. Historical violations remain in the record and remain admissible under state discovery rules.
- The public visibility of the SAFER Company Snapshot. It remains free and searchable.
One more practical point: FMCSA turned down the National Academies of Science recommendation to move to Item Response Theory. That means the scoring model is still additive and percentile-based, just simpler. The push for a more statistically sophisticated model lost.
Practical takeaway
Every SMS citation in a truck accident case now belongs to one of two eras. Before December 1, 2025: BASICs, 959 violations, 1–10 severity. On and after December 1, 2025: Compliance Categories, 116 Violation Groups, two-tier severity, 12-month lookback. Square the two in the record, cite the Federal Register notice, and lock down the underlying inspection records no matter which version displays them.
If a truck crash on or after November 2024 is central to your case and the carrier’s SMS record matters, a free case review is the first step. The records sit with FMCSA and with the carrier, and waiting doesn’t protect either set.
Sources
- Enhanced Carrier Safety Measurement System (Federal Register 2024-27087) — U.S. Federal Register
- CSA Prioritization Preview (official landing) — FMCSA
- FMCSA SMS Changes Part 1 (Jan 16, 2025 webinar deck) — FMCSA
- What's Changing in the FMCSA SMS — FMCSA
- FMCSA Implements Improvements to Its Safety Measurement System — FMCSA Newsroom
- FMCSA proposes long-awaited changes to CSA, eliminates IRT (industry reporting) — FleetOwner
Federal regulations and crash statistics are updated periodically. Figures cited on this page reflect the referenced publications at the time of writing; check the source for the current edition.